1. Define a leadership KPI layer
Start with business intelligence KPIs that leadership reviews weekly and monthly: realization, utilization, WIP aging, AR aging, throughput, and backlog risk.
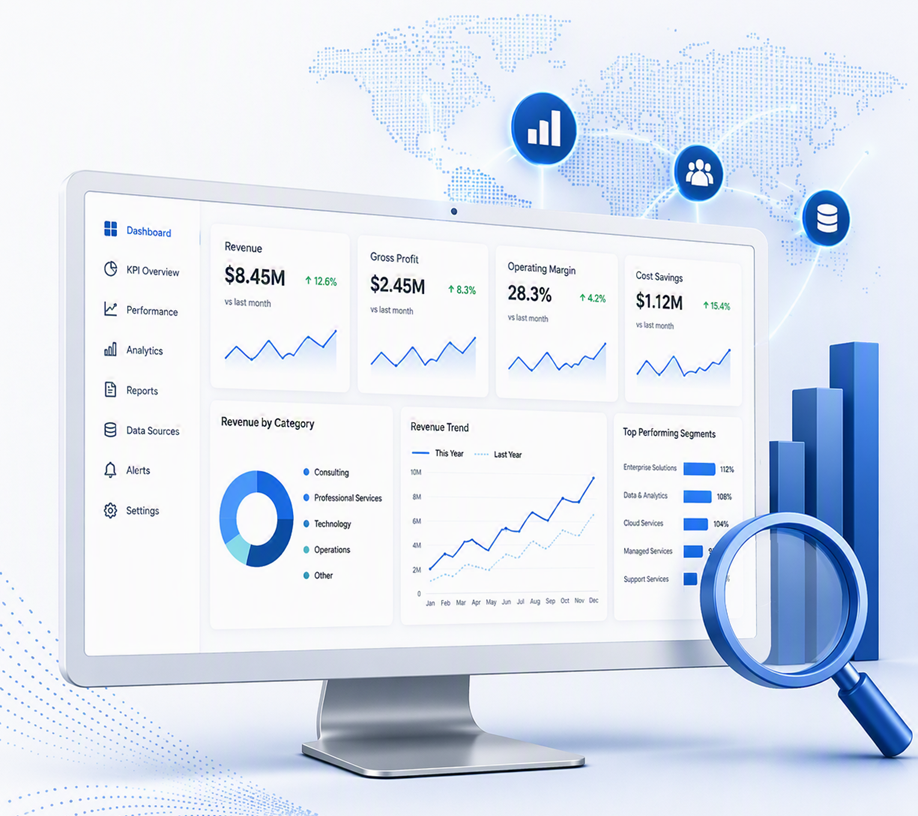
A practical rollout model for operational visibility dashboards, accounting BI governance, and leadership decision cadence.
Operational Visibility
Business operations analytics gives accounting firms a consistent view of what changed, why it changed, and where leaders should intervene first.
Start with business intelligence KPIs that leadership reviews weekly and monthly: realization, utilization, WIP aging, AR aging, throughput, and backlog risk.
Use a role-based layout so partners, firm administrators, and managers can monitor queue health, cycle-time variance, and staffing pressure in real time.
Phase 1: baseline scorecards. Phase 2: workflow diagnostics. Phase 3: predictive indicators and AI-generated narrative summaries.