Realization Rate: The Formula, Benchmarks, and How to Improve It
A healthy accounting firm targets a gross realization rate of 85–92%; below 78% signals a systemic write-down problem. Gross realization is the standard value of hours billed divided by the standard value of hours worked; net realization uses cash collected instead. Below: both formulas, target ranges, write-up and write-down analysis, and the weekly habit that catches slippage early.
Realization Rate for Accounting Firms
82% realization: is that a healthy number, or the early sign of a write-down problem you haven't caught yet?
Realization rate is the single KPI most managing partners check first, and the one most firms calculate inconsistently — some mean gross realization, some mean net, and few review it more than once a month. That gap between how often it should be reviewed and how often it actually is reviewed is where write-downs quietly compound. The same concept drives engagement profitability at any professional services firm that bills by the hour — a law firm or consultancy runs into the identical gap between standard rates and what actually gets collected.
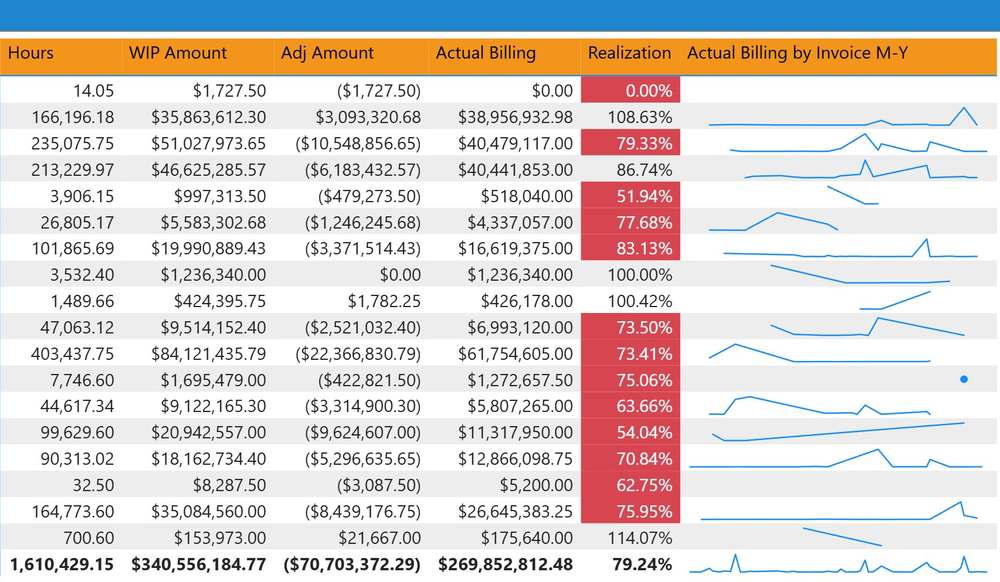
Illustrative dashboard — sample data, not a live client.
What Is Realization Rate?
The percentage of billable time actually billed and collected.
Realization rate measures how much of the value a firm's staff generates in billable hours actually converts to revenue. It's the metric that reveals whether pricing discipline, scope management, and billing practices are working — or quietly eroding margin one write-down at a time.
Gross Realization Rate Formula
Gross realization = (standard value of hours billed ÷ standard value of hours worked) × 100.
Gross realization measures billing discipline alone — how much of the work's standard value made it onto an invoice, regardless of whether the client has paid yet. It's the number that moves first when scope creep or pricing misalignment starts eating into a service line.
Net Realization Rate Formula
Net realization = (cash actually collected ÷ standard value of hours worked) × 100.
Net realization goes one step further than gross and factors in collections, not just billing — so it's always equal to or lower than gross realization. A firm with strong gross realization but weak net realization has a collections problem, not a pricing problem, and needs a different fix.
Realization Rate Benchmark
Target: 85–92% for well-managed firms; below 78% signals a systemic problem.
Realization rate benchmarks vary by firm type and service mix — a specialized tax practice and a small generalist firm don't share the same healthy range. As a general target, well-managed firms hold gross realization at 85–92%. Rates consistently below 78% point to a systemic write-down problem rather than one-off client issues.
Write-Up vs. Write-Down Analysis
Write-downs reduce billed value below standard; write-ups (rarer) bill above it.
A write-down happens when standard value is reduced before or at billing — the far more common event. A write-up happens when a firm bills above standard value, typically for complexity or rush work. A write-up/write-down analysis tracks both by partner and service line, which separates a pricing problem from a collections problem — two different fixes that get missed when realization is only reviewed as one blended number.
Realization Rate Dashboard
Weekly visibility beats month-end discovery.
A realization rate dashboard pulls billing and collections data directly from your practice management system so gross and net realization are visible by partner, client, and service line whenever partners look — not reconstructed from a spreadsheet export once a month, after the write-downs have already happened.
Realization from WIP to cash happens in two steps: billing (how much of standard WIP value is invoiced) and collection (how much of the invoice is paid). Multiply the two and you get net realization — the percentage of standard value actually collected. A firm billing 90% of WIP and collecting 95% of what it bills has a net realization of 85.5%.
Gross WIP vs. Net WIP
Net WIP = gross WIP minus expected write-downs.
Gross WIP is the full standard value (hours × standard rates) of unbilled time. Net WIP is what that time is realistically expected to bill for once anticipated write-downs are taken. The gap between them is realization the firm already expects to lose before any invoice goes out — and it widens as WIP ages.
What Affects Realization — and What Doesn't
Rates, scope, WIP aging, and billing lag move it (collections move net realization); utilization doesn't directly.
Realization moves with standard rate levels, fixed-fee vs. hourly arrangements, scope creep, WIP aging, billing lag, write-downs and write-offs — and, for net realization, collections. Utilization doesn't directly change it: utilization measures how many hours are chargeable, while realization measures how much of those hours' value is billed and collected. A firm can run high utilization and poor realization at the same time.
Realization Rate Benchmark Reference Table
Metric
Best-in-Class Target
Warning Threshold
Review Cadence
Gross Realization Rate
85–92%
Below 78%
Weekly by partner & service line
Net Realization Rate
Tracks closely with gross
Widening gap vs. gross
Monthly
Write-Down Rate
Under 8% of billed time
Trending up month-over-month
Monthly by partner
How to Improve Realization Rate
Catch write-downs at the WIP stage, weekly. Once work is billed, the write-down has already happened. Reviewing WIP before it's invoiced is the only point where a partner can still act.
Standardize billing rates before scope creep sets in. Most write-downs trace back to an engagement that grew past its original scope without a corresponding rate conversation.
Review aging WIP by partner before it crosses 60 days. Older work gets written down more often — clients push back harder on invoices for work they don't remember clearly.
Track billing velocity alongside realization. The two move together: firms that invoice within 0–14 days of work completion collect at higher rates and generate fewer disputes.
Separate net from gross when diagnosing a drop. A falling gross number means a pricing or scope problem; a falling net number with stable gross means a collections problem.
FirmMetrics™ is AccountingTek BI's CPA firm dashboard for realization rate, WIP, AR, and billing KPIs — a billing realization dashboard pulling directly from CCH Practice and calculating gross and net realization automatically, by partner, client, and service line, without a manual export.
Gross realization rate = (standard value of hours billed ÷ standard value of hours worked) × 100. Net realization rate = (cash actually collected ÷ standard value of hours worked) × 100. Gross measures billing discipline; net also factors in collections.
What's the difference between net and gross realization?
Gross realization measures how much of the work's standard value made it onto an invoice. Net realization measures how much of that standard value was actually collected in cash, so it reflects both billing and collections. Net is always equal to or lower than gross — a wide gap between the two points to a collections problem rather than a pricing problem.
What is a good realization rate for an accounting firm?
A normal target for a well-managed accounting firm is a gross realization rate of 85–92%. Rates below 78% signal a systemic write-down problem — often caused by scope creep, pricing misalignment, or billing cycle delays. Best-in-class firms hold realization above 88% by monitoring write-downs weekly by partner and service line.
How can a CPA firm improve its realization rate?
The highest-leverage change is reviewing WIP weekly, before work is billed, rather than reviewing realization after the fact. Pair that with standardized billing rates, a 60-day WIP aging threshold, and tracking billing velocity alongside realization, since billing lag and write-downs move together.
What causes a write-down vs. a write-up?
A write-down reduces billed value below the standard rate — usually from scope creep, pricing misalignment, or a partner discount at billing. A write-up bills above standard value, typically for complexity or rush work, and is far less common. Tracking both separately by partner and service line shows whether a realization drop is a pricing problem or a collections problem.
Is a higher realization rate always better?
Up to a point. Realization well below the 85–92% range means value is leaking through write-downs. But realization that sits at or above 100% month after month usually means standard rates are set too low or time isn't being fully recorded — there's nothing left to write down. Treat sustained realization at or above 100% as a prompt to review standard rates and time-entry discipline, not as a win.
What's the difference between gross WIP and net WIP?
Gross WIP is the full standard value (hours × standard rates) of unbilled time. Net WIP is what that time is realistically expected to bill for after anticipated write-downs. The gap between them is realization the firm already expects to lose before invoicing, and it widens as WIP ages.
How do you calculate realization from WIP to cash collected?
Split it into two rates. Billing realization = amount billed ÷ standard value of WIP. Collection realization = cash collected ÷ amount billed. Multiply them to get net realization, the percentage of standard WIP value that actually became cash: 90% billed × 95% collected = 85.5% net realization.
Which factors affect realization rate — and which don't?
Standard rate levels, fixed-fee vs. hourly arrangements, scope creep, WIP aging, billing lag, write-downs, and write-offs all affect realization, and collections also affect net realization. Utilization doesn't directly: it measures how many hours are chargeable, not how much of their value is billed and collected, so a firm can have high utilization and poor realization at the same time.