
The Staffing Pain Points Quietly Costing Your Accounting Firm Talent and Margin

Overloaded managers burn out and leave. Idle staff drain margin no one notices until year-end. Practical benchmarks and a review cadence for spotting utilization imbalance, workload bottlenecks, and capacity risk before they cost you your best people.

Staffing Pain Points for Accounting Firms

Staffing problems rarely show up as a single bad number. They show up as a good year-end average hiding a manager who's been over capacity for eight straight weeks.

Most accounting firms track total hours and firm-wide utilization — but the blended average hides the real problem: individual staff and managers who are quietly overloaded while others run under capacity. That mismatch, not the average itself, is the single biggest predictor of turnover in accounting firms, and it's invisible in a monthly report that only shows one firm-wide number.

The benchmarks and warning signals below help managing partners and firm administrators spot staffing pain points — overload, imbalance, and bottlenecks — while there's still time to rebalance work, not after a manager has already handed in notice.

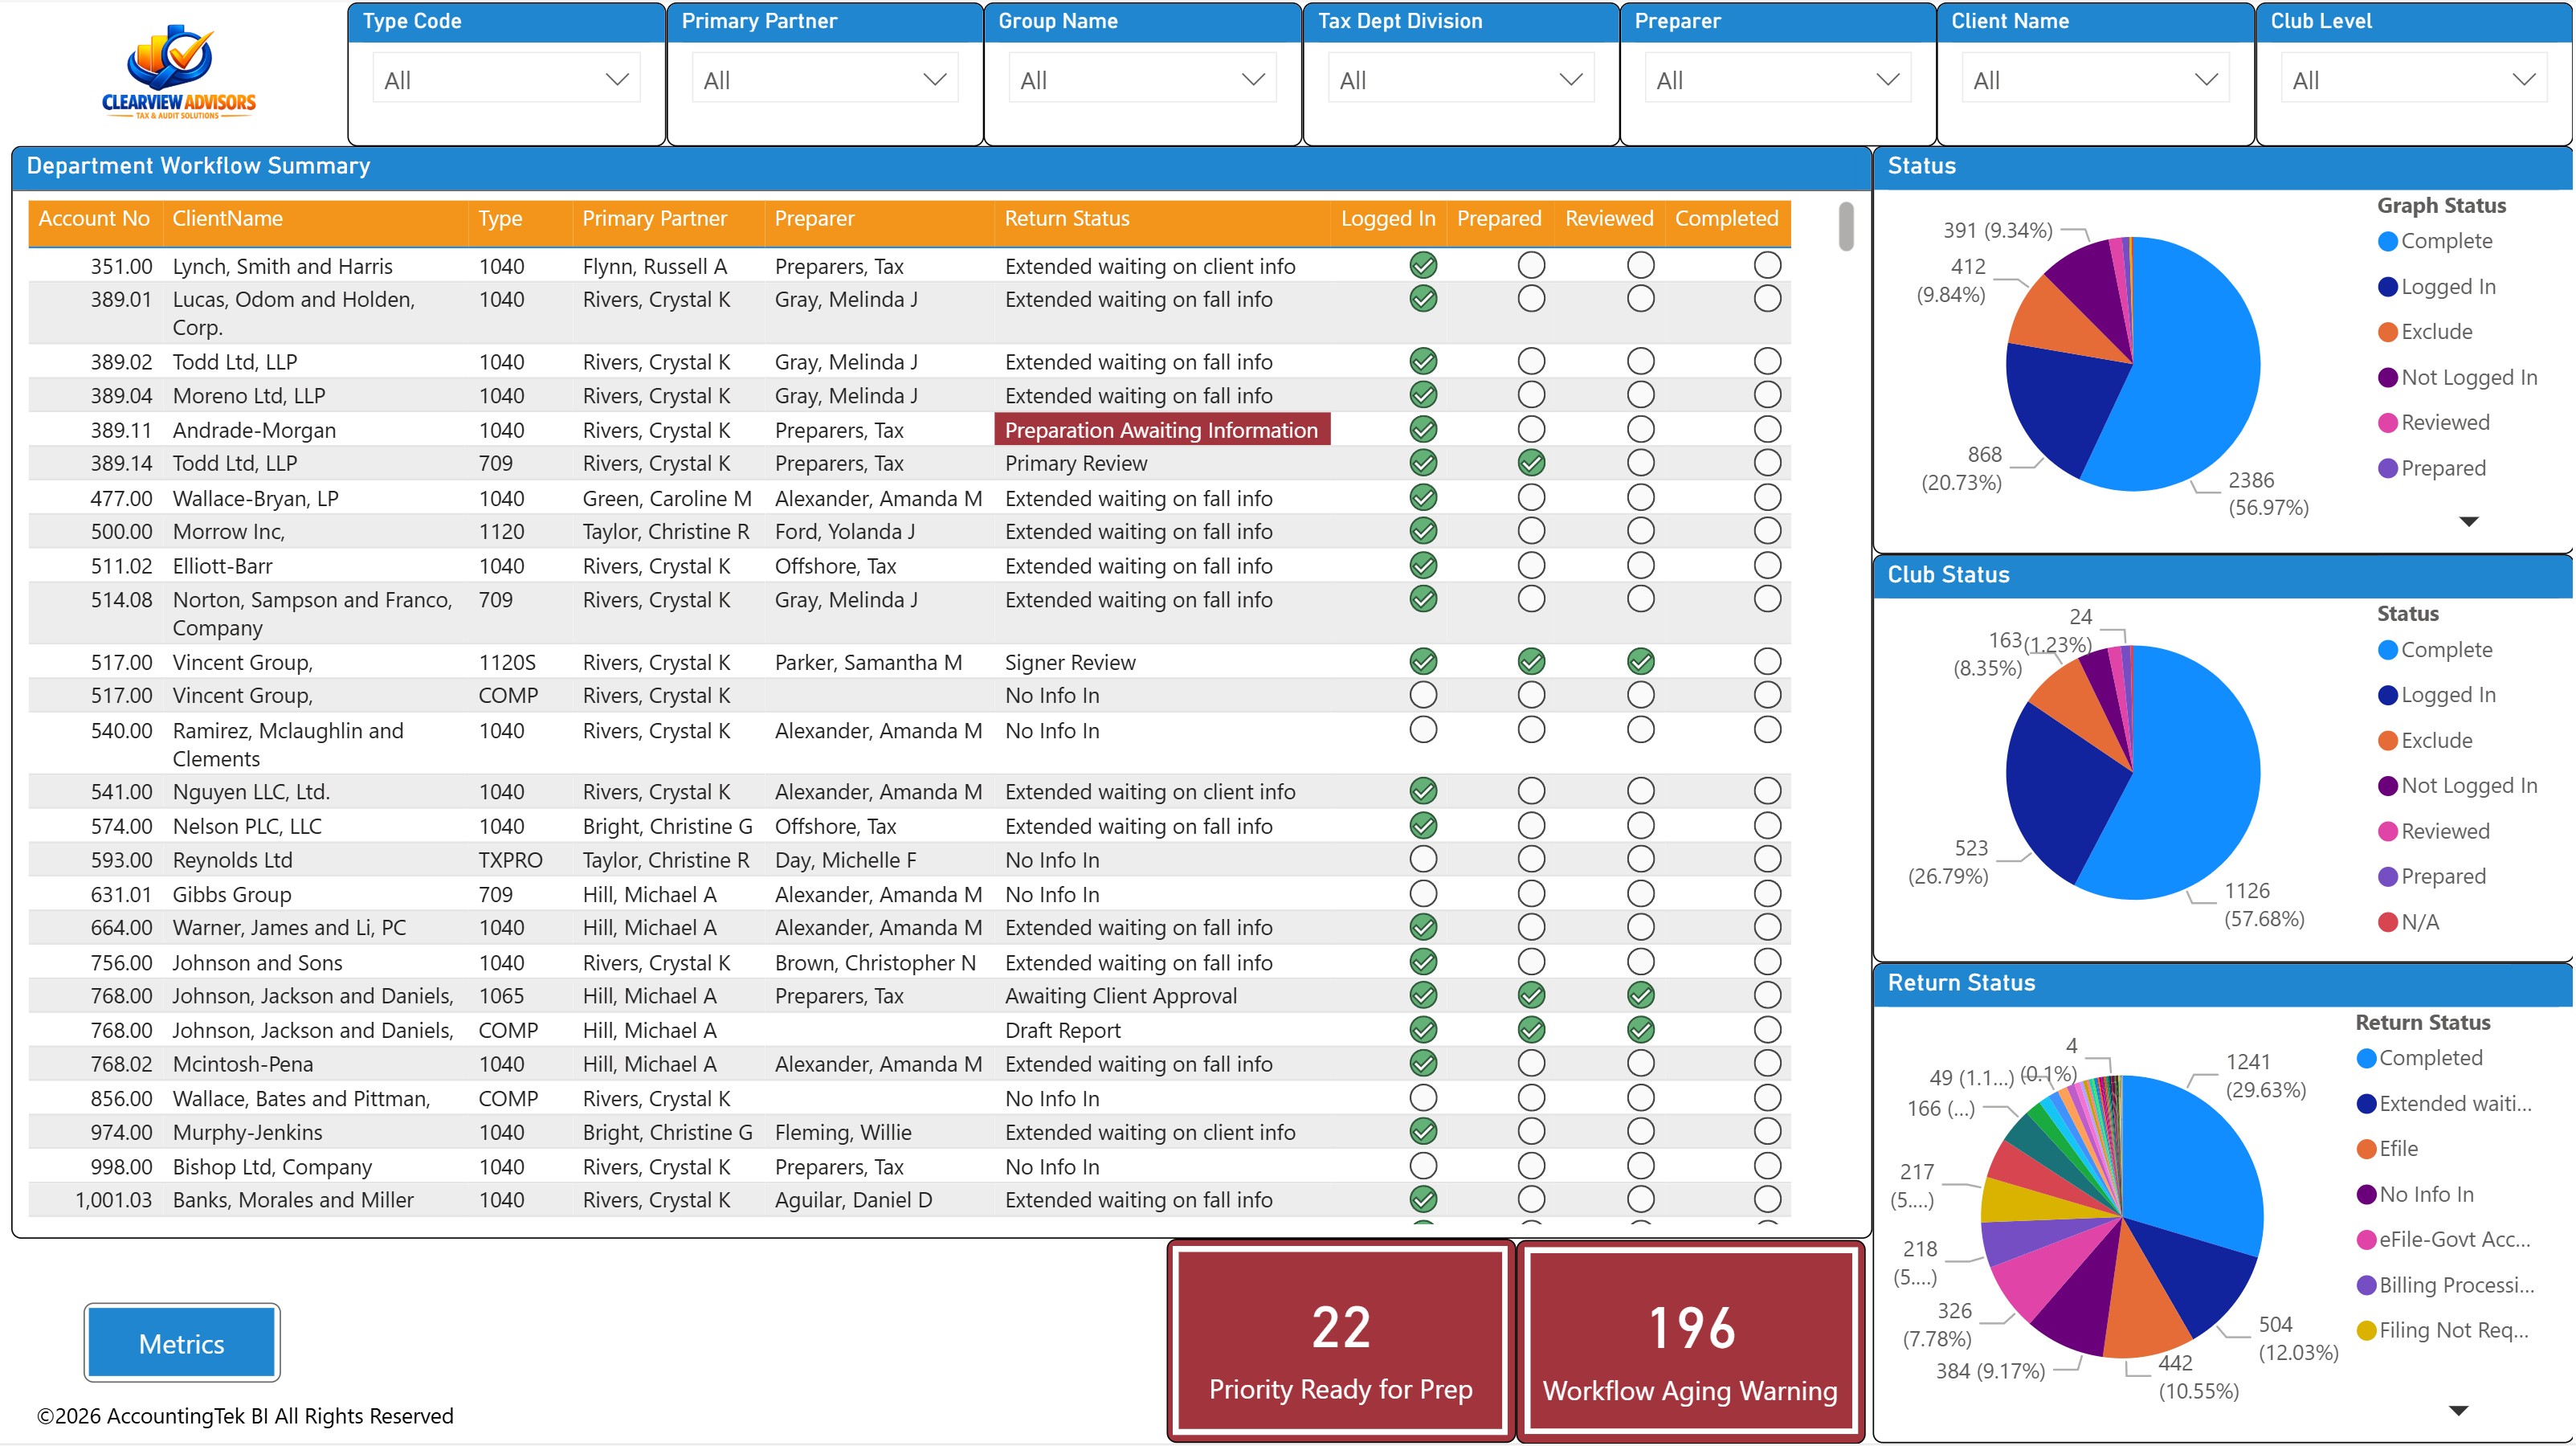
WorkSight Metrics staff workload and department summary dashboard

Utilization Imbalance by Role

Target: staff 80%+, directors/managers 55–70% chargeable — variance from target, not the average, is the signal.

A firm running a healthy 78% average utilization can still have three managers pinned above 85% chargeable for a full quarter while two staff run under 50%. It's the variance from role-based targets — not the blended firm-wide average — that predicts burnout. Track utilization by individual, not just by role group, and flag anyone running 10+ points above their role's target for more than three consecutive weeks.

Uneven Workload Distribution

Target: workload within 15% of team average; flag anyone carrying 25%+ more open work than peers.

The same three or four staff members tend to absorb disproportionate work because they're reliable, fast, or senior — and managers default to assigning to whoever they know can handle it. Left unmanaged, this creates a small group doing an outsized share of the firm's work while other staff stay underutilized. Workload distribution benchmarks catch this pattern before it becomes a retention problem for your best people.

Turnover Risk Signals

Warning sign: utilization 15+ points over target for 4+ consecutive weeks.

Turnover doesn't happen because of one bad week — it happens because of a pattern that goes unaddressed. Staff and managers who run significantly over their utilization target for a month or more, especially outside peak season, are the highest-risk group for attrition. This is a leading indicator firms can act on weeks or months before an exit interview, if someone is watching for the pattern in real time rather than reviewing utilization once a quarter.

Tax Season Capacity Planning

Plan capacity 6–8 weeks ahead using prior-year cycle time and current staffing levels.

Most firms plan tax season staffing on headcount and gut feel, not data — how long returns actually took last year, by complexity and by preparer, against how many are queued for this year. Firms that model expected volume against real cycle-time history catch capacity shortfalls in March, not April 10th, giving managers time to redistribute work or bring in support before deadlines are at risk.

Bottleneck Stage Dwell Time

Target: no single workflow stage holding more than 20% of active jobs for 2+ weeks.

When returns or engagements consistently stall at a specific stage — partner review, client information requests, or a particular manager's queue — the bottleneck usually isn't about total headcount. It's a stage-specific chokepoint that adding staff elsewhere won't fix. Tracking dwell time by workflow stage shows exactly where jobs are stuck and who's holding them, so firms can address the actual constraint instead of guessing.

Manager Span of Control

Target: 6–10 direct reports per manager for review-heavy workflows; recalibrate above 12.

A manager stretched across too many direct reports can't give timely review feedback, which slows the whole team down and feeds directly into the bottleneck problem above. Span of control isn't one-size-fits-all — it depends on review complexity and staff experience — but a manager consistently reviewing work for 12+ staff during peak season is a structural staffing risk, not something better software alone will fix.

Staffing & Capacity Planning Benchmark Reference Table — Accounting Firms
Staffing KPI Best-in-Class Target Warning Threshold Review Cadence
Staff Utilization 80%+ chargeable Below 60% or above 95% sustained Weekly
Director/Manager Utilization 55–70% chargeable Below 55% or above 80% sustained Weekly
Workload Distribution Variance Within 15% of team average Single staff member 25%+ above average Weekly
Sustained Overload (Turnover Risk) No role >10 pts over target, 3+ weeks 15+ points over target for 4+ weeks Weekly; flag immediately
Bottleneck Stage Dwell Time No stage holds >20% of active jobs, 2+ weeks Single stage >30% of active jobs Weekly
Manager Span of Control 6–10 direct reports 12+ direct reports during peak season Quarterly; at staffing changes

How to Use Staffing Benchmarks in Practice

Staffing benchmarks are most useful when built into a regular review cadence rather than surfaced only after someone resigns. The firms that catch staffing pain points early follow a consistent rhythm:

  • Weekly: Review individual utilization variance and workload distribution across staff and managers. Flag anyone trending outside benchmark range for two consecutive weeks.
  • Monthly: Review bottleneck stage dwell time and turnover risk signals firm-wide. Have a direct conversation with any manager showing sustained overload.
  • Quarterly, and before tax season: Review span of control and department sizing against workload volume. Recalibrate staffing plans before peak season starts, not after it's already underway.

The challenge most firms run into is that this data lives in three different places — time and billing, practice workflow, and informal manager knowledge — so pulling it together takes real effort. That effort is exactly why the cadence breaks down, and why staffing problems tend to surface for the first time in an exit interview instead of a weekly review.

WorkSight Metrics™ & FirmMetrics™: Staffing Visibility Built for Accounting Firms

WorkSight Metrics™ connects directly to CCH Workflow to surface staff load by person and team, bottleneck stages, and AI-driven cycle time forecasts in real time — the operational side of the staffing picture: who's overloaded right now, and where work is piling up.

FirmMetrics™ tracks utilization and chargeability by individual and role from CCH Practice or Practice CS, giving managing partners the KPI side of the same picture — so utilization imbalance and workload overload show up in the same weekly review instead of two disconnected reports.

For target utilization ranges by role, see our accounting firm KPI benchmarks guide. For the monthly review cadence that makes staffing benchmarks actionable, see our KPI Playbooks guide.

Staffing Pain Points: Frequently Asked Questions

What percentage of a tax manager's time should be billable?

Tax managers typically target 55–70% chargeable utilization, lower than staff accountants (80%+) because managers carry review, supervision, and business development responsibilities that aren't directly billable. A tax manager running significantly above 70% for multiple consecutive weeks is a capacity warning sign, not a productivity win.

How do I know if my accounting firm is understaffed?

Look past the firm-wide utilization average. Understaffing shows up as workload concentrated on a small group of staff running well above target while bottleneck stages hold jobs longer than usual — not necessarily as a high firm-wide number, since averages can mask individual overload even when the firm looks adequately staffed on paper.

What's a healthy accounting department size relative to workload?

There's no universal ratio — it depends on service mix, client complexity, and review requirements — but manager span of control is a useful proxy: 6–10 direct reports per manager works for most review-heavy accounting workflows. Consistently running above 12 direct reports per manager, especially during peak season, signals the department needs either more managers or a workload redistribution.

How can I tell which staff are being overloaded before they burn out?

Track workload distribution variance, not just total hours. Staff carrying 25% or more open work than their team average, or running 15+ points over their utilization target for four or more consecutive weeks, are the highest-risk group. These are leading indicators that show up weeks before performance or attrition problems become visible.

What causes staffing bottlenecks during tax season?

Most tax season bottlenecks trace back to a specific workflow stage — commonly partner review or client information requests — rather than an overall headcount shortage. Tracking dwell time by stage shows exactly where jobs are stuck, so firms can address the actual constraint instead of assuming more staff will fix a stage-specific chokepoint.

How does WorkSight Metrics help with staff capacity planning?

WorkSight Metrics™ connects directly to CCH Workflow to show staff load by person and team, bottleneck stages, and AI-driven cycle time forecasts in real time — giving managing partners the visibility to rebalance work and plan capacity before deadlines create a crisis, instead of discovering overload after a manager has already burned out.