
Partner Performance & Service Line Profitability

Revenue per partner, revenue per employee, and service line profitability formulas — and why rising revenue can still mean falling margin if you're only tracking the top-line number.

Partner & Service Line Performance for Accounting Firms

Revenue per partner going up looks like good news. It isn't always.

Revenue per partner, revenue per employee, and service line profitability are the metrics used most often in partner meetings — and the ones most often tracked as an absolute number instead of a trend. A rising revenue-per-partner figure that's coming from lower realization or thinner margins per engagement isn't growth; it's margin erosion wearing a growth number.

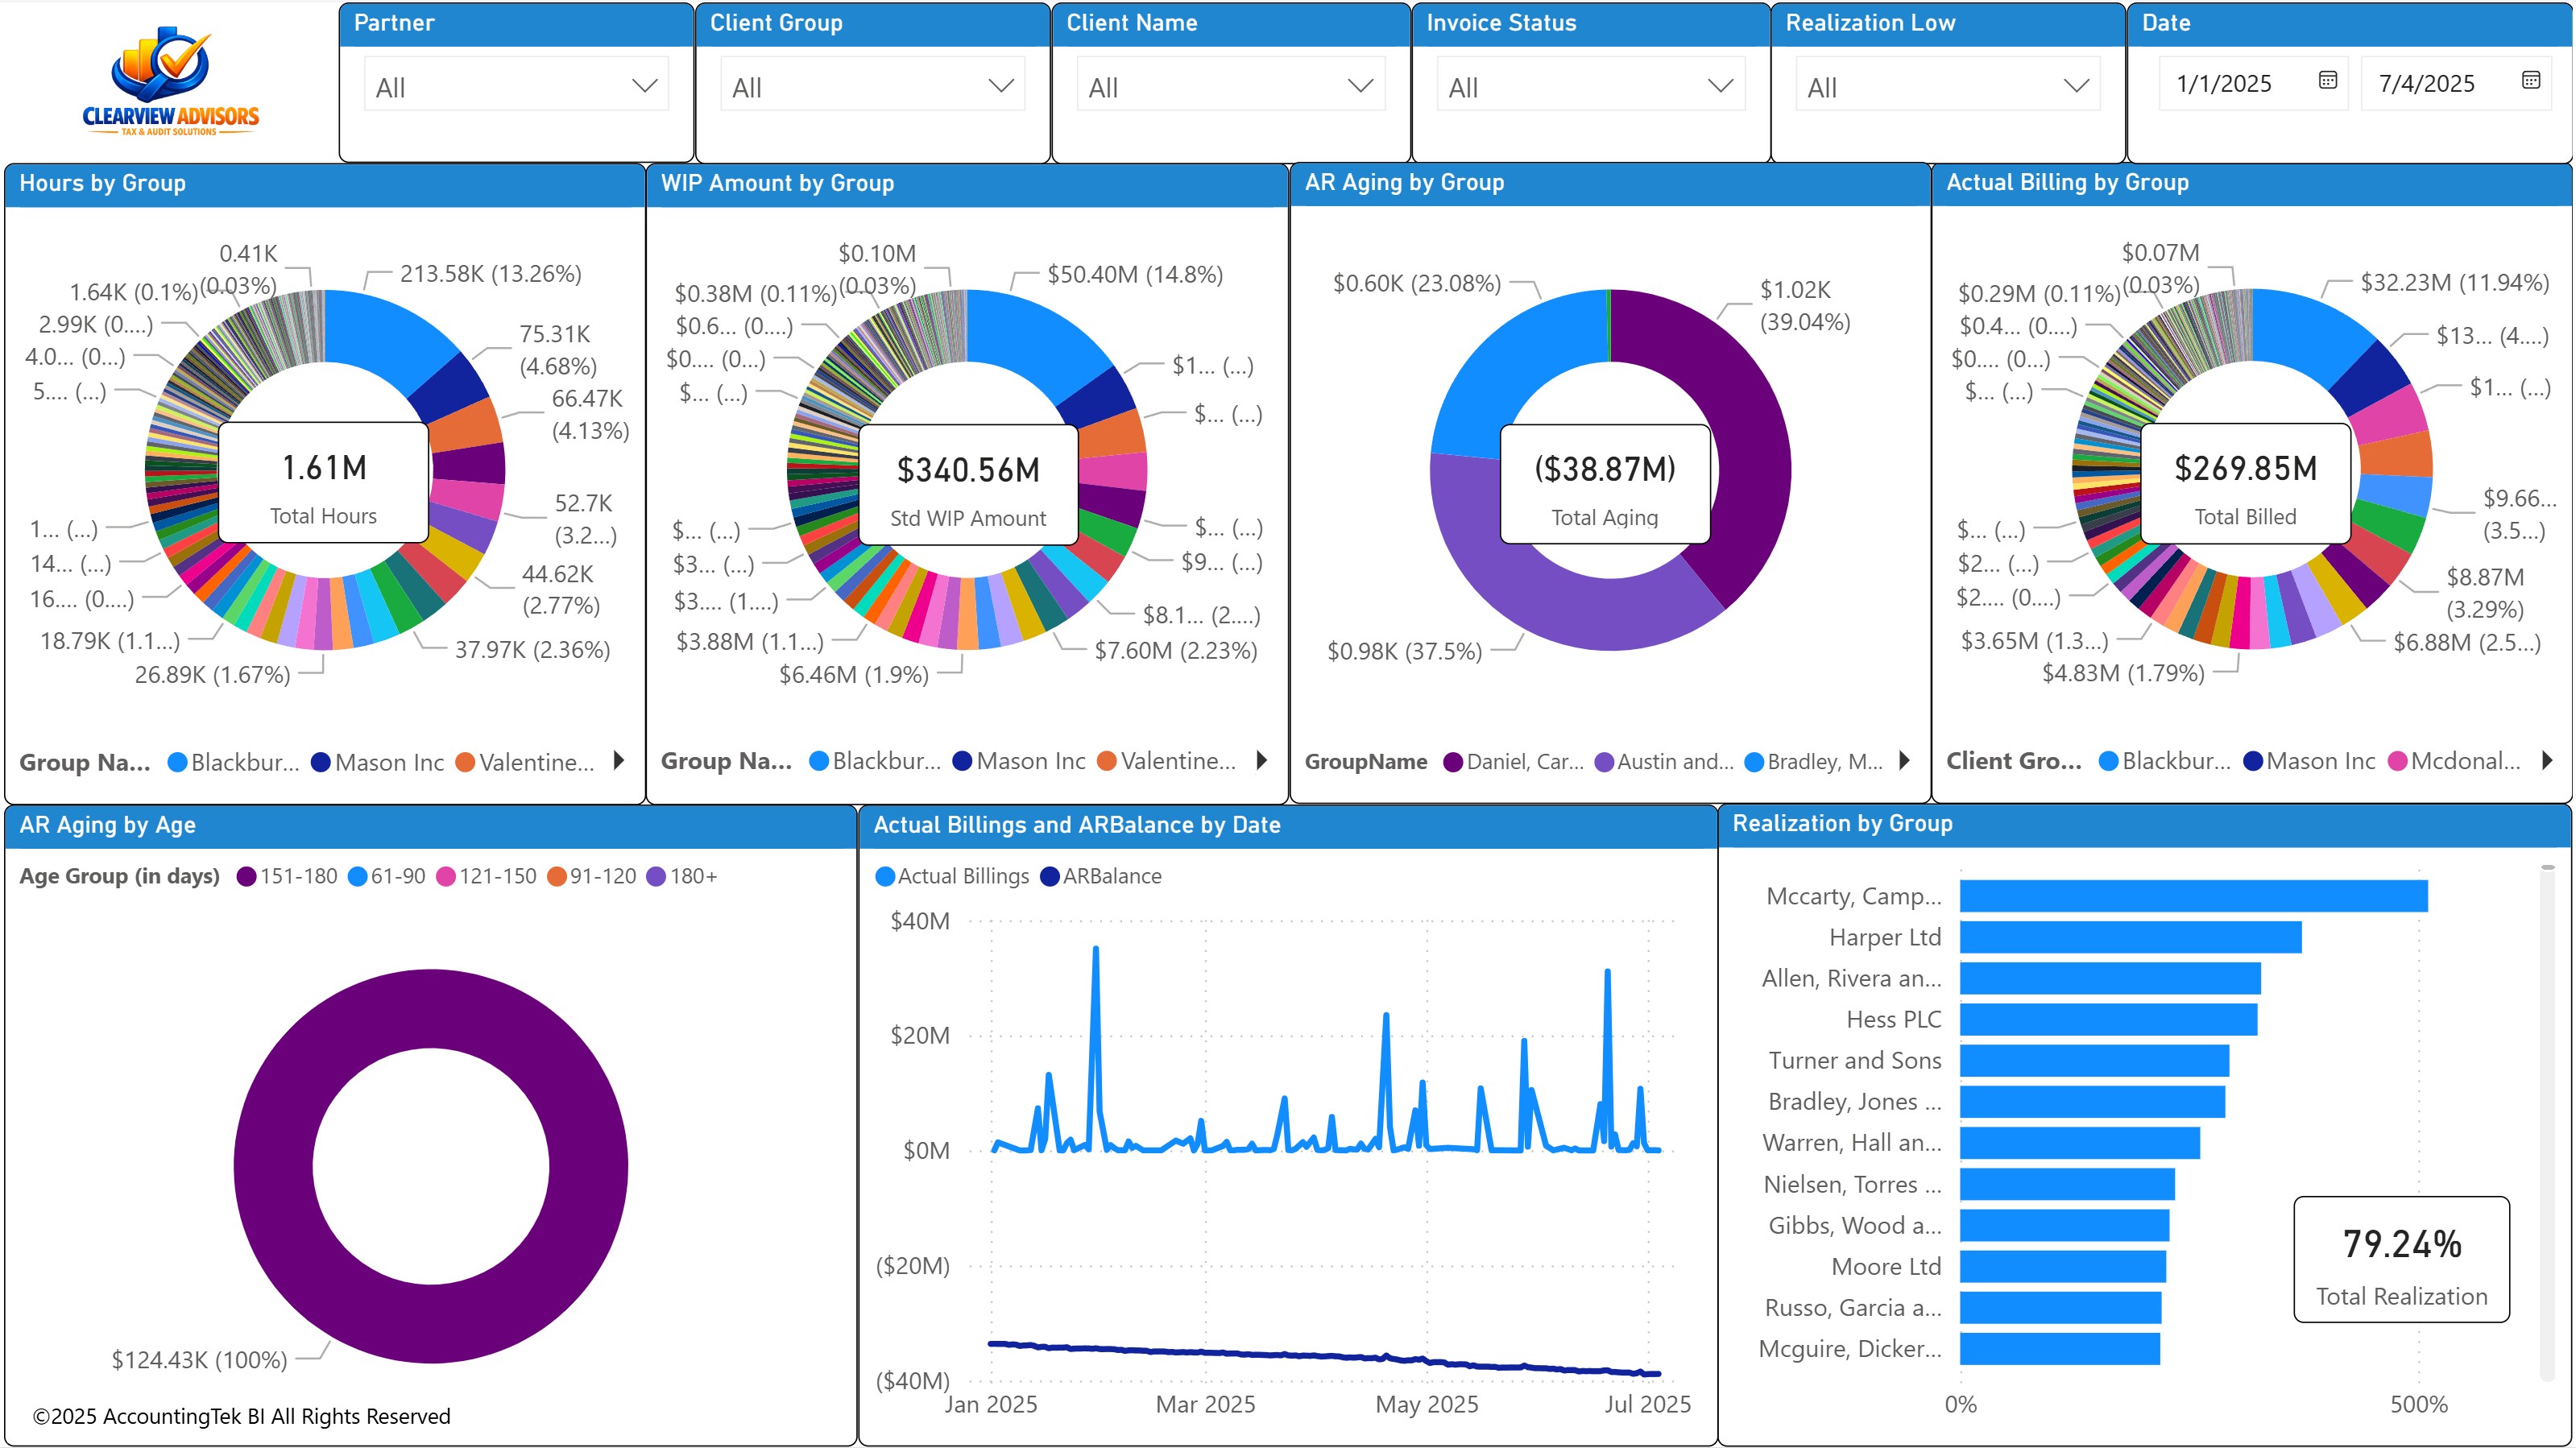
Partner performance dashboard for accounting firms

Revenue Per Partner

Revenue per partner = total firm revenue ÷ number of partners.

Revenue per partner varies too widely by market, service mix, and firm size to use as an absolute cross-firm benchmark. It's most useful tracked as a relative trend within your own firm, alongside realization rate and write-down rate by partner book — that combination shows whether revenue growth is coming from healthy billing and collection practices or masking margin erosion underneath.

Revenue Per Employee & Per Professional

Total revenue ÷ headcount, or ÷ billable professional headcount.

Revenue per employee includes all staff, including non-billable support roles; revenue per professional narrows the denominator to billable staff only, which makes it the more useful figure for comparing productivity across firms of different support-staff ratios. Both are trend metrics, not absolute targets — what matters is the direction relative to headcount growth.

Service Line Profitability

Margin by service line, not just revenue by service line.

Service line profitability tracks realization, effective billing rate, and margin separately for each practice area — tax, audit, advisory. Firm-wide averages routinely hide one service line quietly subsidizing another; margin by service line is what surfaces that mix problem so pricing or staffing can be adjusted line by line.

Partner Performance Dashboard: What It Should Actually Show

A partner performance dashboard that only shows revenue per partner is showing half the picture. The version that actually drives decisions pairs revenue per partner with realization rate, write-down rate, and margin by service line for that partner's book — so a managing partner can tell the difference between a partner growing the firm profitably and one growing volume while realization quietly slips.

Partner & Service Line Performance Reference Table
Metric How to Use It Warning Sign Review Cadence
Revenue Per Partner Track as a firm-relative trend, not an industry benchmark Rising alongside falling realization Quarterly
Revenue Per Professional Compare against prior-year trend by role tier Flat or declining with rising headcount Quarterly
Service Line Margin Compare service lines against each other, not one absolute target One line consistently below firm-wide average Quarterly by service line

FirmMetrics™: Partner and Service Line Views, Automatically

FirmMetrics™ breaks realization, WIP, AR, and billing KPIs down by partner and service line automatically, from CCH Practice or Practice CS — so a partner performance dashboard shows realization and margin trend alongside revenue, not revenue alone.

To find which specific clients are driving a service line's margin problem, see our How to Identify Unprofitable Clients guide. For the full benchmark set, see our Accounting Firm KPI Benchmarks guide.

Partner & Service Line Performance: Frequently Asked Questions

What's a good revenue-per-partner benchmark for a CPA firm?

Revenue per partner varies too widely by market, service mix, and firm size to use as an absolute cross-firm benchmark. It's most useful tracked as a relative trend within your own firm, alongside realization rate and write-down rate by partner book — that combination shows whether revenue growth is coming from healthy billing and collection practices or masking margin erosion underneath.

What's the difference between revenue per employee and revenue per professional?

Revenue per employee divides total revenue by total headcount, including non-billable support staff. Revenue per professional narrows the denominator to billable staff only, making it the more useful figure for comparing productivity across firms with different support-staff ratios.

How do you measure service line profitability?

Track realization rate, effective billing rate, and margin separately for each practice area — tax, audit, advisory — rather than relying on a firm-wide average. Firm-wide numbers routinely hide one service line subsidizing another; margin by service line is what surfaces that mix problem.

What should a partner performance dashboard include?

More than revenue per partner alone. A useful partner performance dashboard pairs revenue per partner with realization rate, write-down rate, and margin by service line for that partner's book, so leadership can distinguish a partner growing the firm profitably from one growing volume while realization quietly slips.